
Let us understand arbitrage using a simple example. Arbitrage means difference in prices within/across markets. The most simple example is retail arbitrage. A retailer of grocery items buys from wholesalers like Metro Cash & Carry and sells grocery in local mom-and-pop store. The retailer pockets the difference in return for his time and efforts. This simple process of pocketing a small difference is called arbitrage There are various other types of arbitrages like risk arbitrage and statistical arbitrage. For the purpose of this article, we shall focus on statistical arbitrage.
Statistical arbitrage is pocketing a small difference by taking position in multiple assets. For spotting such opportunities, one needs to study historical price patterns and take the position when it makes maximum sense statistically to take that position. Let us take an example in the Indian stock market context.
HDFC Limited and HDFC Bank are two securities which have a high correlation. Correlation means if one share is going up, the other will also go up. This can be seen in the chart of both shares as shown below:
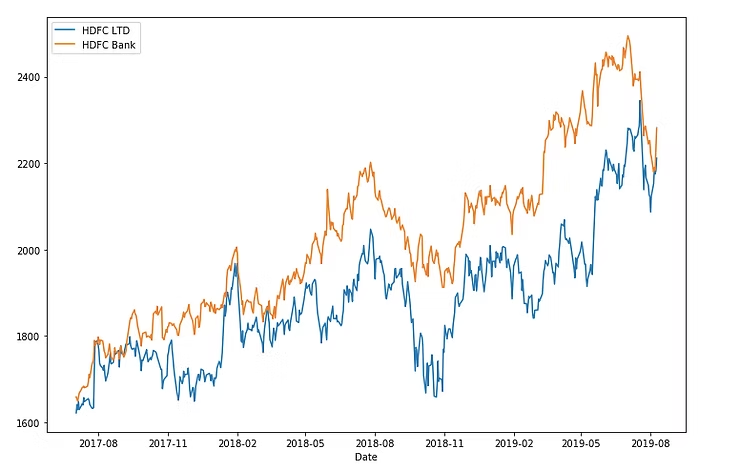
Graphical representation of correlation between HDFC Bank and HDFC Ltd prices
The python code to get the above chart is as follows:
import numpy as np
import pandas as pd
import matplotlib.pyplot as plt
import nsepy as ny
from datetime import date
A1 = ny.get_history(symbol = ‘HDFC’,
start = date(2017,7,1),
end = date(2019,8,10))
A2 = ny.get_history(symbol = ‘HDFCBANK’,
start = date(2017,7,1),
end = date(2019,8,10))
# result = coint(A1[[‘Close’]], A2[[‘Close’]])
# score = result[0]
# value = result[1]
A1[‘Close’].plot(figsize=(12,8))
A2[‘Close’].plot()
plt.legend((‘HDFC LTD’,’HDFC Bank’))
After plotting the prices on a chart, we actually confirm statistically whether the stocks we are checking are cointegrated. For this use the following python code:
import statsmodels
from statsmodels.tsa.stattools import coint
score, pvalue, _ = coint(A1[[‘Close’]], A2[[‘Close’]])
pvalue
Make sure that the p-value you get from the above code is small. In our case, the output of p-value is 0.03. This small p-value indicated that there is good co-integration between the prices of two stocks under consideration. ‘statsmodels’ is a python library we are using here to make the statistical calculations for verifying that the two variables are cointegrated. Learn more here.
The next step is to check the difference between the share price of the two securities. We execute the following code:
diff_series= S2[[‘Close’]] – S1[[‘Close’]]
diff_series.plot(figsize=(12,8))
Output for the above code is the below chart:
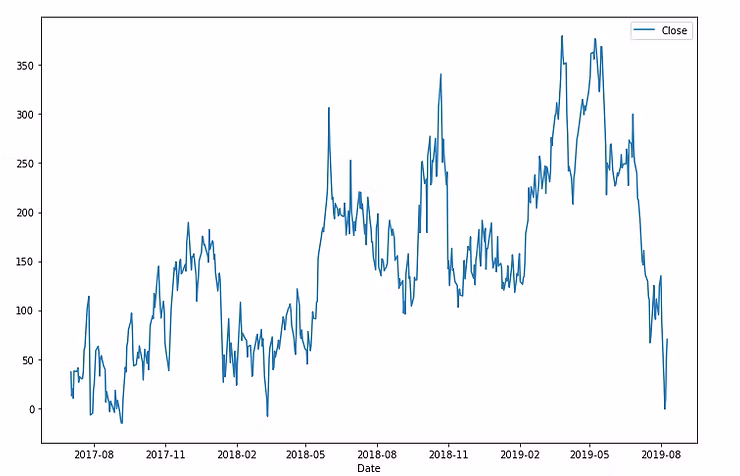
Difference between price of HDFC Bank and HDFC Ltd
Next, we calculate the z-score of the difference variable (HDFC Bank – HDFC Ltd). Plotting this z-score gives us the desired output of finding trade opportunities.
def zscore(series):
return (series – series.mean()) / np.std(series)
zscore(diff_series).plot(figsize=(12,8))
plt.axhline(2.0, color=’red’, linestyle=’–‘)
plt.axhline(-2.0, color=’green’, linestyle=’–‘)
plt.axhline(0, color=’magenta’, linestyle=’–‘)
The output is as follows
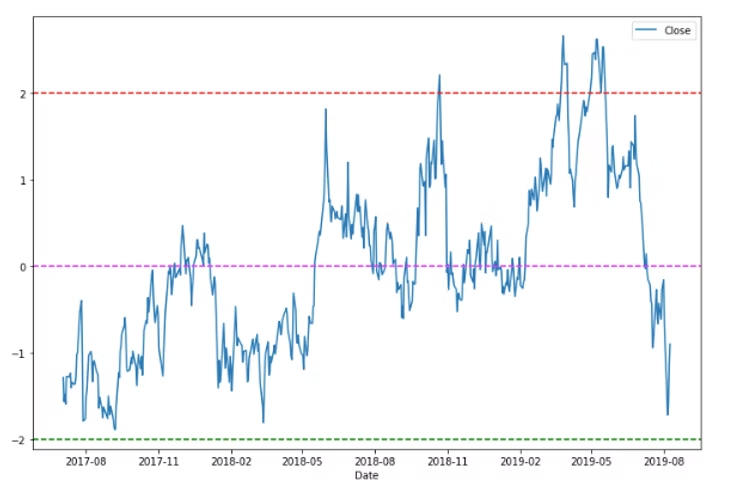
How to interpret the above result?
Firstly, do not get scared by the amount of statistics involved. As a trader, you do not need to master statistics here. All you have to do is use it well.
The last chart we have here shows that the z-score of the difference variable moves in a range of -2 to +2. This means that whenever the value approaches +2, HDFC Bank has reached the statistical peak when compared to HDFC Ltd. At this stage, there is a pair trade opportunity by selling HDFC Bank and buying HDFC Ltd. Similarly, when the z-score value is -2, there is a pair trade opportunity by selling HDFC Ltd and buying HDFC Bank.
Word of caution on pair trading:
Statistical trading works beautifully. However, as a trader, you should be watchful of extreme movement due to changes in fundamentals. Example, if HDFC Ltd is lagging behind due to poor performance of some subsidiary, but HDFC Bank is performing very well, the statistical arbitrage may take more than anticipated time to fill. In this case, a trader may have to see a drawdown on the account.
All the best with trading! In case you are interested in learning more such strategies, get in touch with us here.